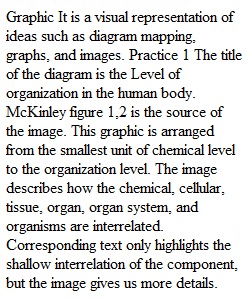
Q Getting Ready for A&P: Understanding Graphics • Points 10 • Submitting a text entry box or a file upload Assignment Instructions Step 1: Read about understanding graphics The purpose of textbook graphics is to summarize and condense information. Many students mistakenly consider graphics not as important as the written part of the textbook, and often gloss over or skip them when studying. Modern textbooks rely on graphics not only to support the text, but often as the sole means to present new concepts and vocabulary. There are many methods for understanding graphics. If you already use one that has been successful for you, by all means continue to use it in this course. For this assignment, you will use the following are 5 steps to understand any graphic you encounter. 1. What is the title of the graphic? Is the graphic's purpose clear? Read the legend and explanatory notes. Is the source of the graphic listed? 2. How is the graphic organized? Where should you begin and how should you proceed to understand what is being presented? 3. Are there variables in this graphic? Is there any information about scale, values, or units of measurement provided? 4. Are there comparisons or relationships being described? Can you identify any patterns? Read the graphic in context with its corresponding text. Note what is different about the text and the graphic. 5. Paraphrase the information presented in the graphic in your notes. Paraphrasing graphic information is essential for exam preparation. Step 2: Practice Understanding Graphics Apply the the 5 steps for understanding graphics to the following two examples. You will place your answers to step 2 in the dropbox for this assignment when you are finished. Practice graphic 1: from McKinley text Figure 1.2 Levels of Organization in the Human Body Practice Graphic 1 Corresponding Text: The cells at the cellular level together form the tissue level. The next level is the organ level followed by the organ system. The various organ systems lead to an organism. Practice graphic 2: similar to McKinley text Figure 3.8 Activation Energy (Ea) Practice Graphic 2 Corresponding Text: This graph shows a comparison of activation energy (Ea) of an uncatalyzed reaction and a catalyzed reaction by the enzyme carbonic anhydrase. Note that enzymes only facilitate chemical reactions to proceed that would already occur; their presence increases the rate of product formation by lowering the Ea. What to Submit Place your analyses of the two practice graphics in the Text Entry box for this assignment, OR you may upload a document with your answers to the assignment dropbox. Understanding Graphics Criteria Ratings Pts This criterion is linked to a Learning OutcomeAnalysis of Practice Graphic 1 5 pts Full Marks Steps 1-5 of Graphic Analysis are clear and complete. 3 pts Partial Marks Some steps of Graphic analysis are missing or all steps are incomplete 0 pts No Marks Graphic 1 analysis not completed or very incomplete. 5 pts This criterion is linked to a Learning OutcomeAnalysis of Practice Graphic 2 5 pts Full Marks Steps 1-5 of Graphic Analysis are clear and complete. 3 pts Partial Marks Some steps of Graphic analysis are missing or all steps are incomplete 0 pts No Marks Graphic 2 analysis not completed or very incomplete. 5 pts Total Points: 10 Expectations A rubric will be used to grade your rubric assignment and rubric. Scroll down to view the rubric. I will provide feedback using the Rubric, which you can view from the Grades area. Rubric Understanding Graphics
View Related Questions